Teaching Aid
Animation can be used to foster discovery and learning. Educative animations are widespread, in all domains, and for all ages. We list five roles in this category.
Providing affordance and preview
Animation can be used to attract users’ attention to widgets or methods that may otherwise be hard to discover or understand. Appropriate graphic design might reveal the affordance of a widget and its functionality, but animation can make it more no-ticeable and better explain how to use it, or offer a preview of what the tool can do.
An animation can be used to prompt users to use a sliding gesture to unlock a phone. The GestureBar prompts the user with a short animation of how to perform a gesture when the associated icon is selected, such as a rubbing gesture with the eraser tool.
Zeleznik, R. C., Bragdon, A., Liu, C., & Forsberg, A. (2008). Lineogrammer: creating diagrams by drawing. In Proc. UIST, 161-170.
Google Sketchup’s instructor (http://www.sketchup.com/) and proxemics interaction provide contextual assistance by featuring the tool in use or a ges-ture to perform in a short looping animation. While demonstrating what a tool can do, the contextual aids do not, however, provide guidance on how the tool works (see next role). Some websites have to resort to adding an animated arrow at the bottom of the screen to encourage users to scroll when nothing else en-courages them to do so.
Vogel, D. and Balakrishnan, R (2004). Interactive public ambi-ent displays: transitioning from implicit to explicit, public to personal, interaction with multiple users. Proc. of UIST’04, 137-146.
Training, demonstration by example
Animations are commonly used as tutorials of how to complete a task through demonstration by example.
JugglingLab allows users to author juggling patterns. The result is an animation of a stickman juggling colored balls. Learners can rotate the view and control the animation.
ToolClips adds short narrated demonstrations to the traditional text descriptions of tooltips.
Grossman, T., & Fitzmaurice, G. (2010). ToolClips: an investi-gation of contextual video assistance for functionality under-standing. In Proc. CHI’10, 1515-1524.
Sukaviriya, P., Isaacs, E. and Bharat, K., 1992, June. Multimedia help: a prototype and an experiment. In Proceedings of the SIGCHI conference on Human factors in computing systems (pp. 433-434). ACM.
Canceko, J., Caraway, B., Pak, S. and Nakatsu, K., 2004, April. KONEKT: connecting the audience through judging at the Olympic games. In CHI'04 Extended Abstracts on Human Factors in Computing Systems (pp. 1661-1665). ACM.
Palmiter, S. and Elkerton, J., 1991, April. An evaluation of animated demonstrations of learning computer-based tasks. In Proceedings of the SIGCHI conference on Human Factors in Computing Systems (pp. 257-263). ACM.
Explaining how a system works
Animations are often used in educative applications and media to explain how a system works.
An animation can used to explain a variety of phenomena such as how the heart works by showing ventricular beats and how this activity drives and regulates blood flow, or “how a mechanical watch works” to depict how energy is transferred from the barrel to the wheels and to the clock hands. These educative dynam-ic illustrations are often integrated within a larger communication medium for storytelling
Pane, J.F., Corbett, A.T. and John, B.E., 1996, April. Assessing dynamics in computer-based instruction. In Proceedings of the SIGCHI conference on Human Factors in Computing Systems (pp. 197-204). ACM.
Grossman, T., Chevalier, F. and Kazi, R.H., 2015, April. Your Paper is Dead!: Bringing Life to Research Articles with Animated Figures. In Proceedings of the 33rd Annual ACM Conference Extended Abstracts on Human Factors in Computing Systems (pp. 461-475). ACM.
Illustrating an algorithm
Animation can be used to illustrate a mathematically defined simulation, or an algorithm.
One of the pioneer use of animations proposed by Baecker was to explain how an algorithm works. In Sorting out Sorting, an animation shows how the elements are rearranged by different sorting algorithms.
Baecker, Ronald. "Sorting out sorting: A case study of software visualization for teaching computer science." Software visu-alization: Programming as a multimedia experience 1 (1998): 369-381.
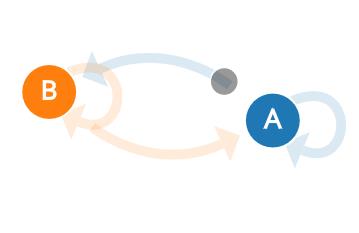
Setosa (http://setosa.io/) proposes a series of animations that explain the logics of mathematical concepts. For instance, to explain Markov chains, a ball travels through a graph representation of the chain, from node to node on the chain, deciding on the next edge to follow with respect to probabilities associated to the edges.
Stasko, J., Badre, A. and Lewis, C., 1993, May. Do algorithm animations assist learning?: an empirical study and analysis. In Proceedings of the INTERACT'93 and CHI'93 conference on Human factors in computing systems (pp. 61-66). ACM.
Teaching a new representation of information
Animation can be used to help users learn a novel spatial layout or a new visual encoding altogether by demonstrating how items are transformed (grouped, aggregated or divided, change visual properties), and moved to their final location.
Animation is used in Twinlist, an interface to help physicians compare two separate lists of medications. Animation is used only initial to teach users how the items in the initial 2 lists are reor-ganized and grouped based on similarities and differences between items in the lists.
Plaisant, C., Chao, T., Wu, J., Hettinger, A., Herskovic, J., Johnson, T., Bernstam, E., Markowitz, E., Powsner, S., Shnei-derman, B. (2013) Twinlist: Novel User Interface Designs for Medication Reconciliation. In Proc. AMIA, 1150-1159.
Animation is also used in NodeTrix to illustrate how matrix representations of graphs correspond to more familiar node-link diagrams.
Henry, N., Fekete, J., & McGuffin, M.J. (2007). NodeTrix: a Hybrid Visualization of Social Networks. In IEEE TVCG, 13 (6), 1302-1309.